
ACADEMIC PUBLICATION • DATA ANALYSIS
Household Energy Prediction
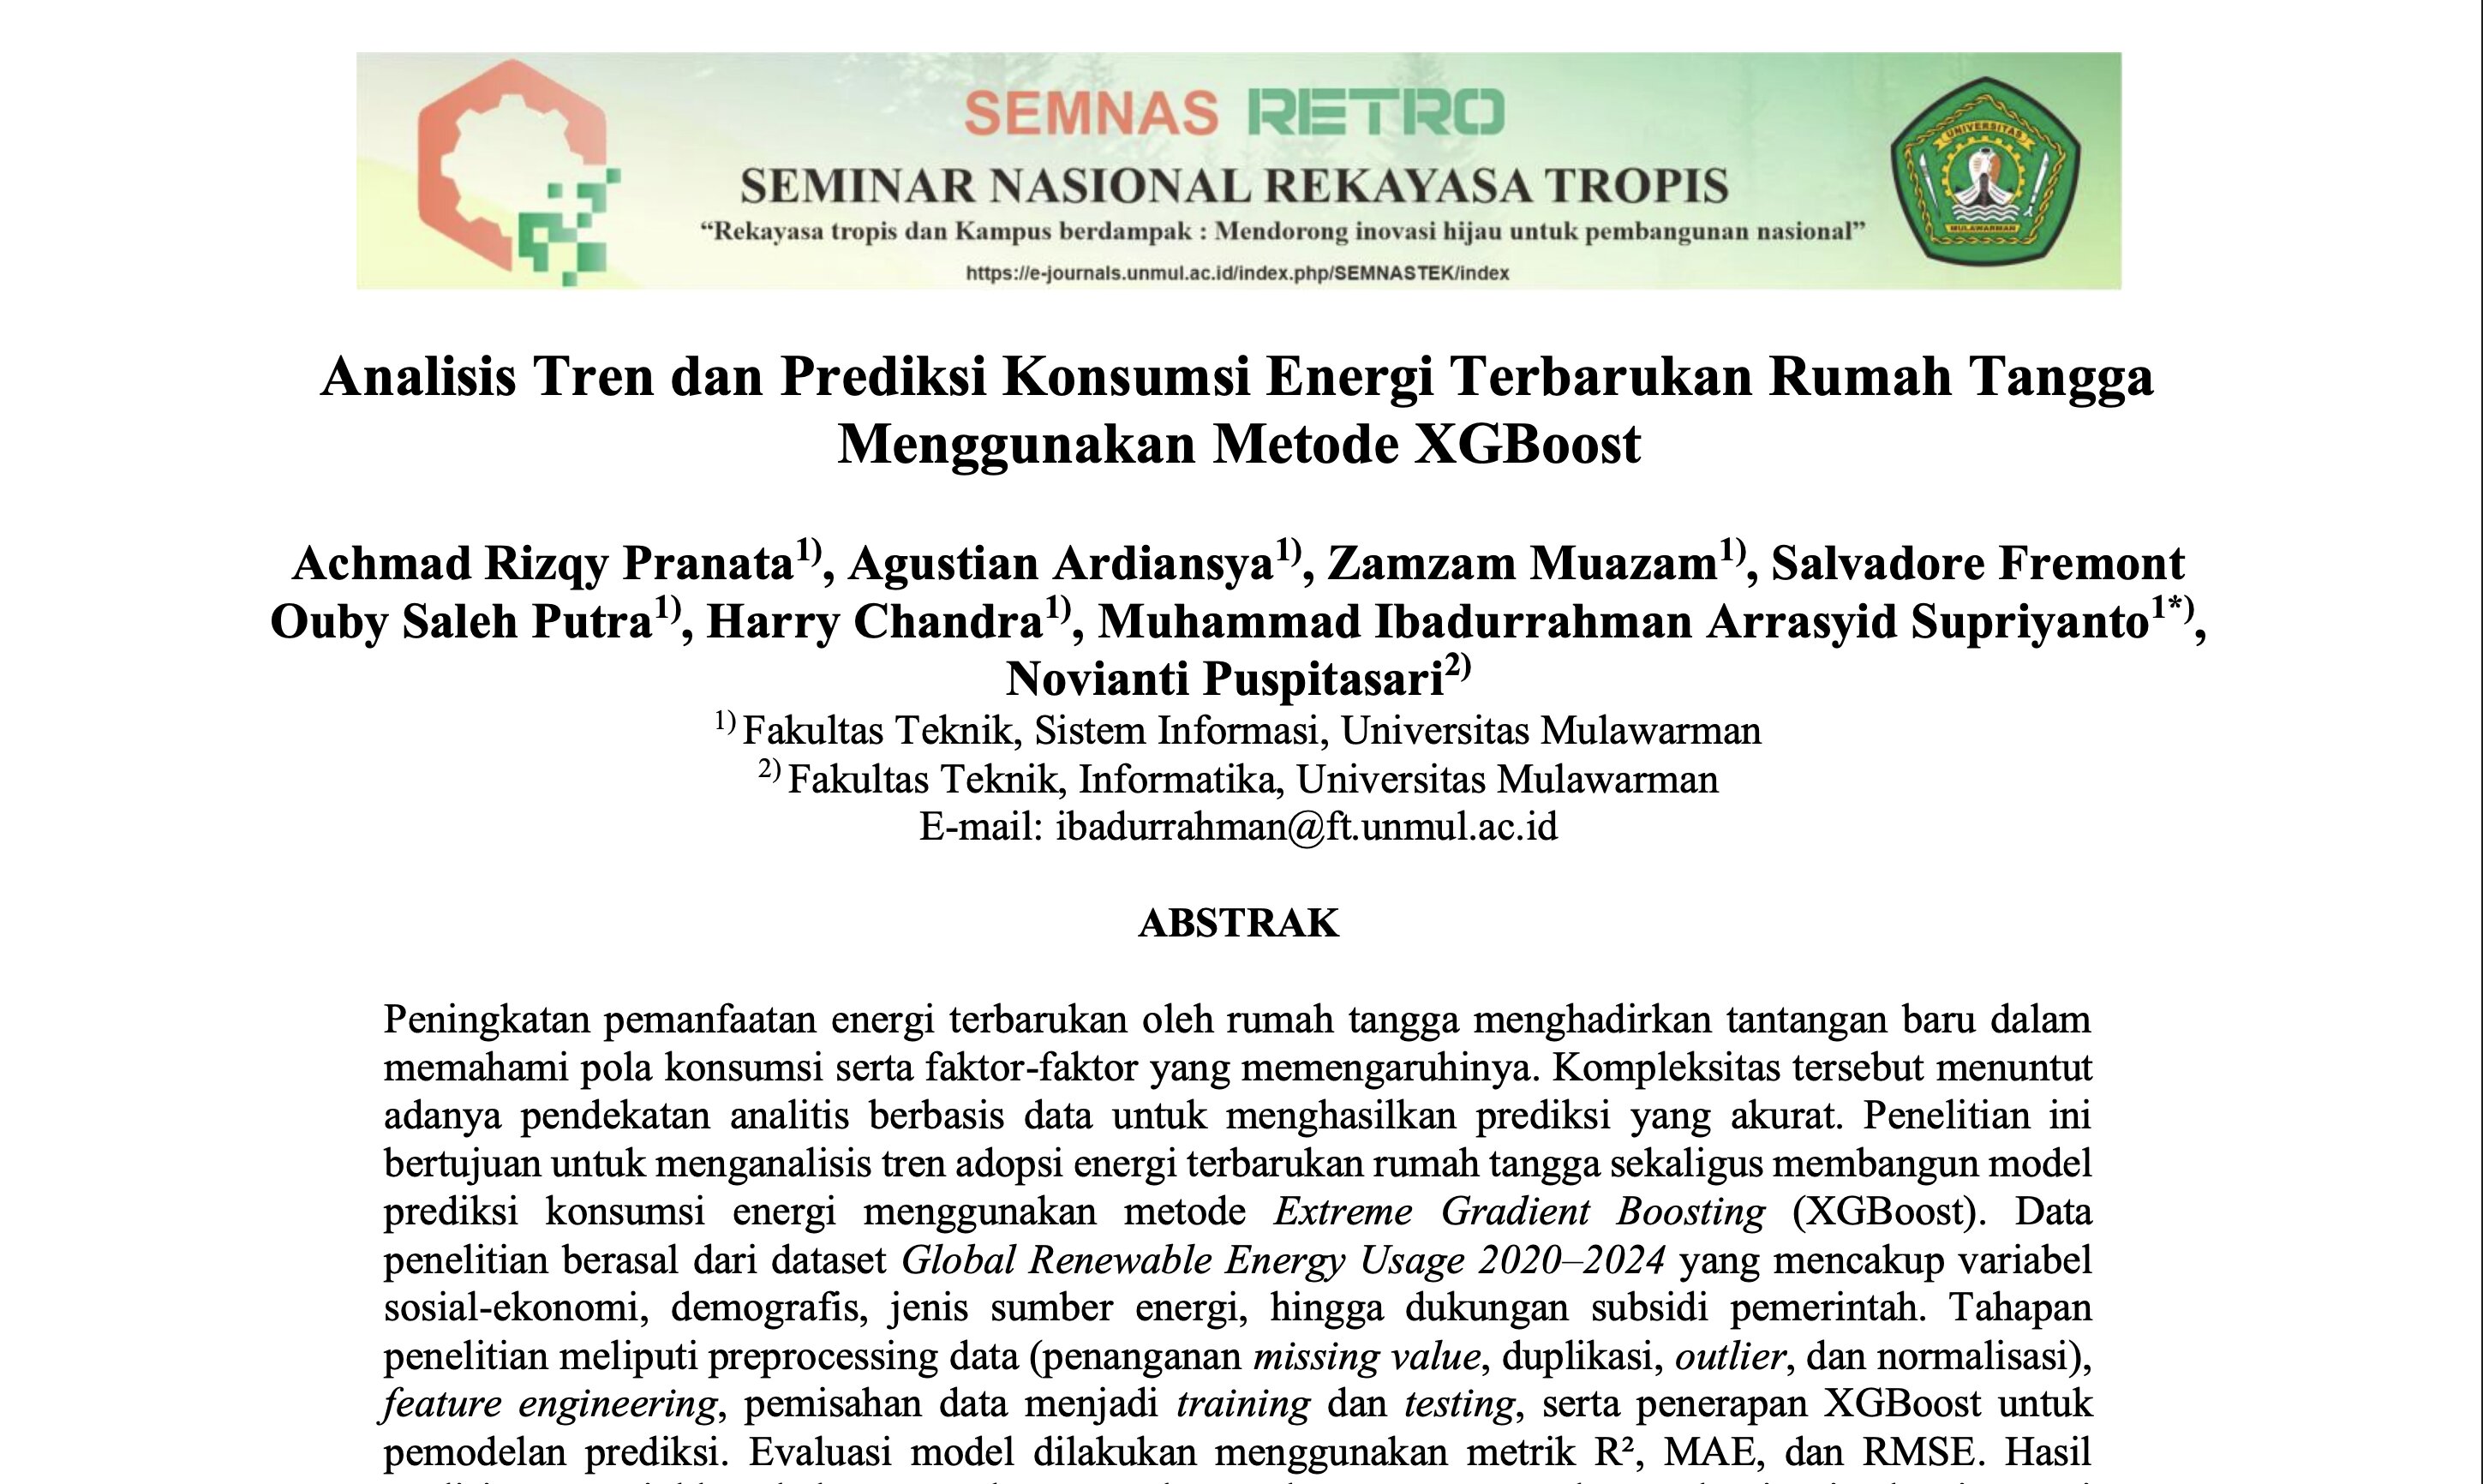
A published research paper predicting how much renewable energy households use, based on data from 1,000 homes worldwide between 2020 and 2024. I was first author, presented at the National Seminar on Tropical Engineering in November 2025.
Overview
More households around the world are switching to solar, wind and other renewable energy. How much they actually use varies enormously, though, and it is not obvious why. This study set out to find the patterns and then build something that could predict a household's monthly usage. We worked with a public dataset covering 1,000 households across six regions, recording things like which energy source they use, household size, income level, whether they receive a government subsidy, and how much they save. Real data is never tidy, so a large part of the work was cleaning it: removing duplicates, handling gaps and unusual values, and putting everything on a comparable scale. We then built a prediction model using XGBoost, a machine learning method that learns by correcting its own mistakes over and over. Trained on 80% of the data and tested on the remaining 20%, it predicted monthly usage with an R² of 0.9881. Beyond the prediction, the analysis showed clear patterns. Middle-income households adopt renewables most, wind is the most common source, solar has grown steadily year on year, and cost savings per kWh matter far more than any demographic factor.
Problem
Household energy use is shaped by many things at once: the type of energy, income, family size, government subsidies. They interact in ways that are hard to untangle by eye. Without a reliable way to predict demand, planners and policymakers are largely guessing about how much energy households will need and what would actually encourage more people to switch.
Solution
We combined two approaches. First, visual analysis to show the patterns plainly: which regions lead, which energy sources people choose, and how preferences shifted from 2020 to 2024. Second, a prediction model. We added two new calculated measures to the data, savings per kWh and a low/medium/high usage category, then trained XGBoost to estimate monthly usage. Checking which inputs the model relied on most revealed what genuinely drives consumption, rather than what we assumed would.
Challenges
Cleaning the data took longer than building the model. Missing entries, duplicated rows, extreme values and inconsistent spelling all had to be dealt with first, because a model trained on messy data produces confident answers that happen to be wrong. Another challenge was that the columns were not comparable. Household size is a single digit while savings run into thousands, and left as-is the larger numbers can drown out the smaller ones. Rescaling everything to the same range put each factor on equal footing. Finally, the results had to be genuinely readable. A model that predicts well but cannot explain itself is of little use to a policymaker, so we analysed which factors carried the most weight and presented that visually alongside the accuracy figures.
Result
The paper was published in the National Seminar on Tropical Engineering, Volume 5 Number 1, November 2025, with me as first author among a team of seven from Universitas Mulawarman. The model reached an R² of 0.9881 with an average error of about 29 kWh per month. The analysis found that middle-income households lead renewable adoption, wind is the most widely used source, solar has climbed steadily since 2020, and Europe has the highest adoption while Australia has the lowest. Most strikingly, cost savings per kWh accounted for over 70% of the model's decision-making, far ahead of income, location or subsidies.
Related Projects
Buan Nongki Samarinda
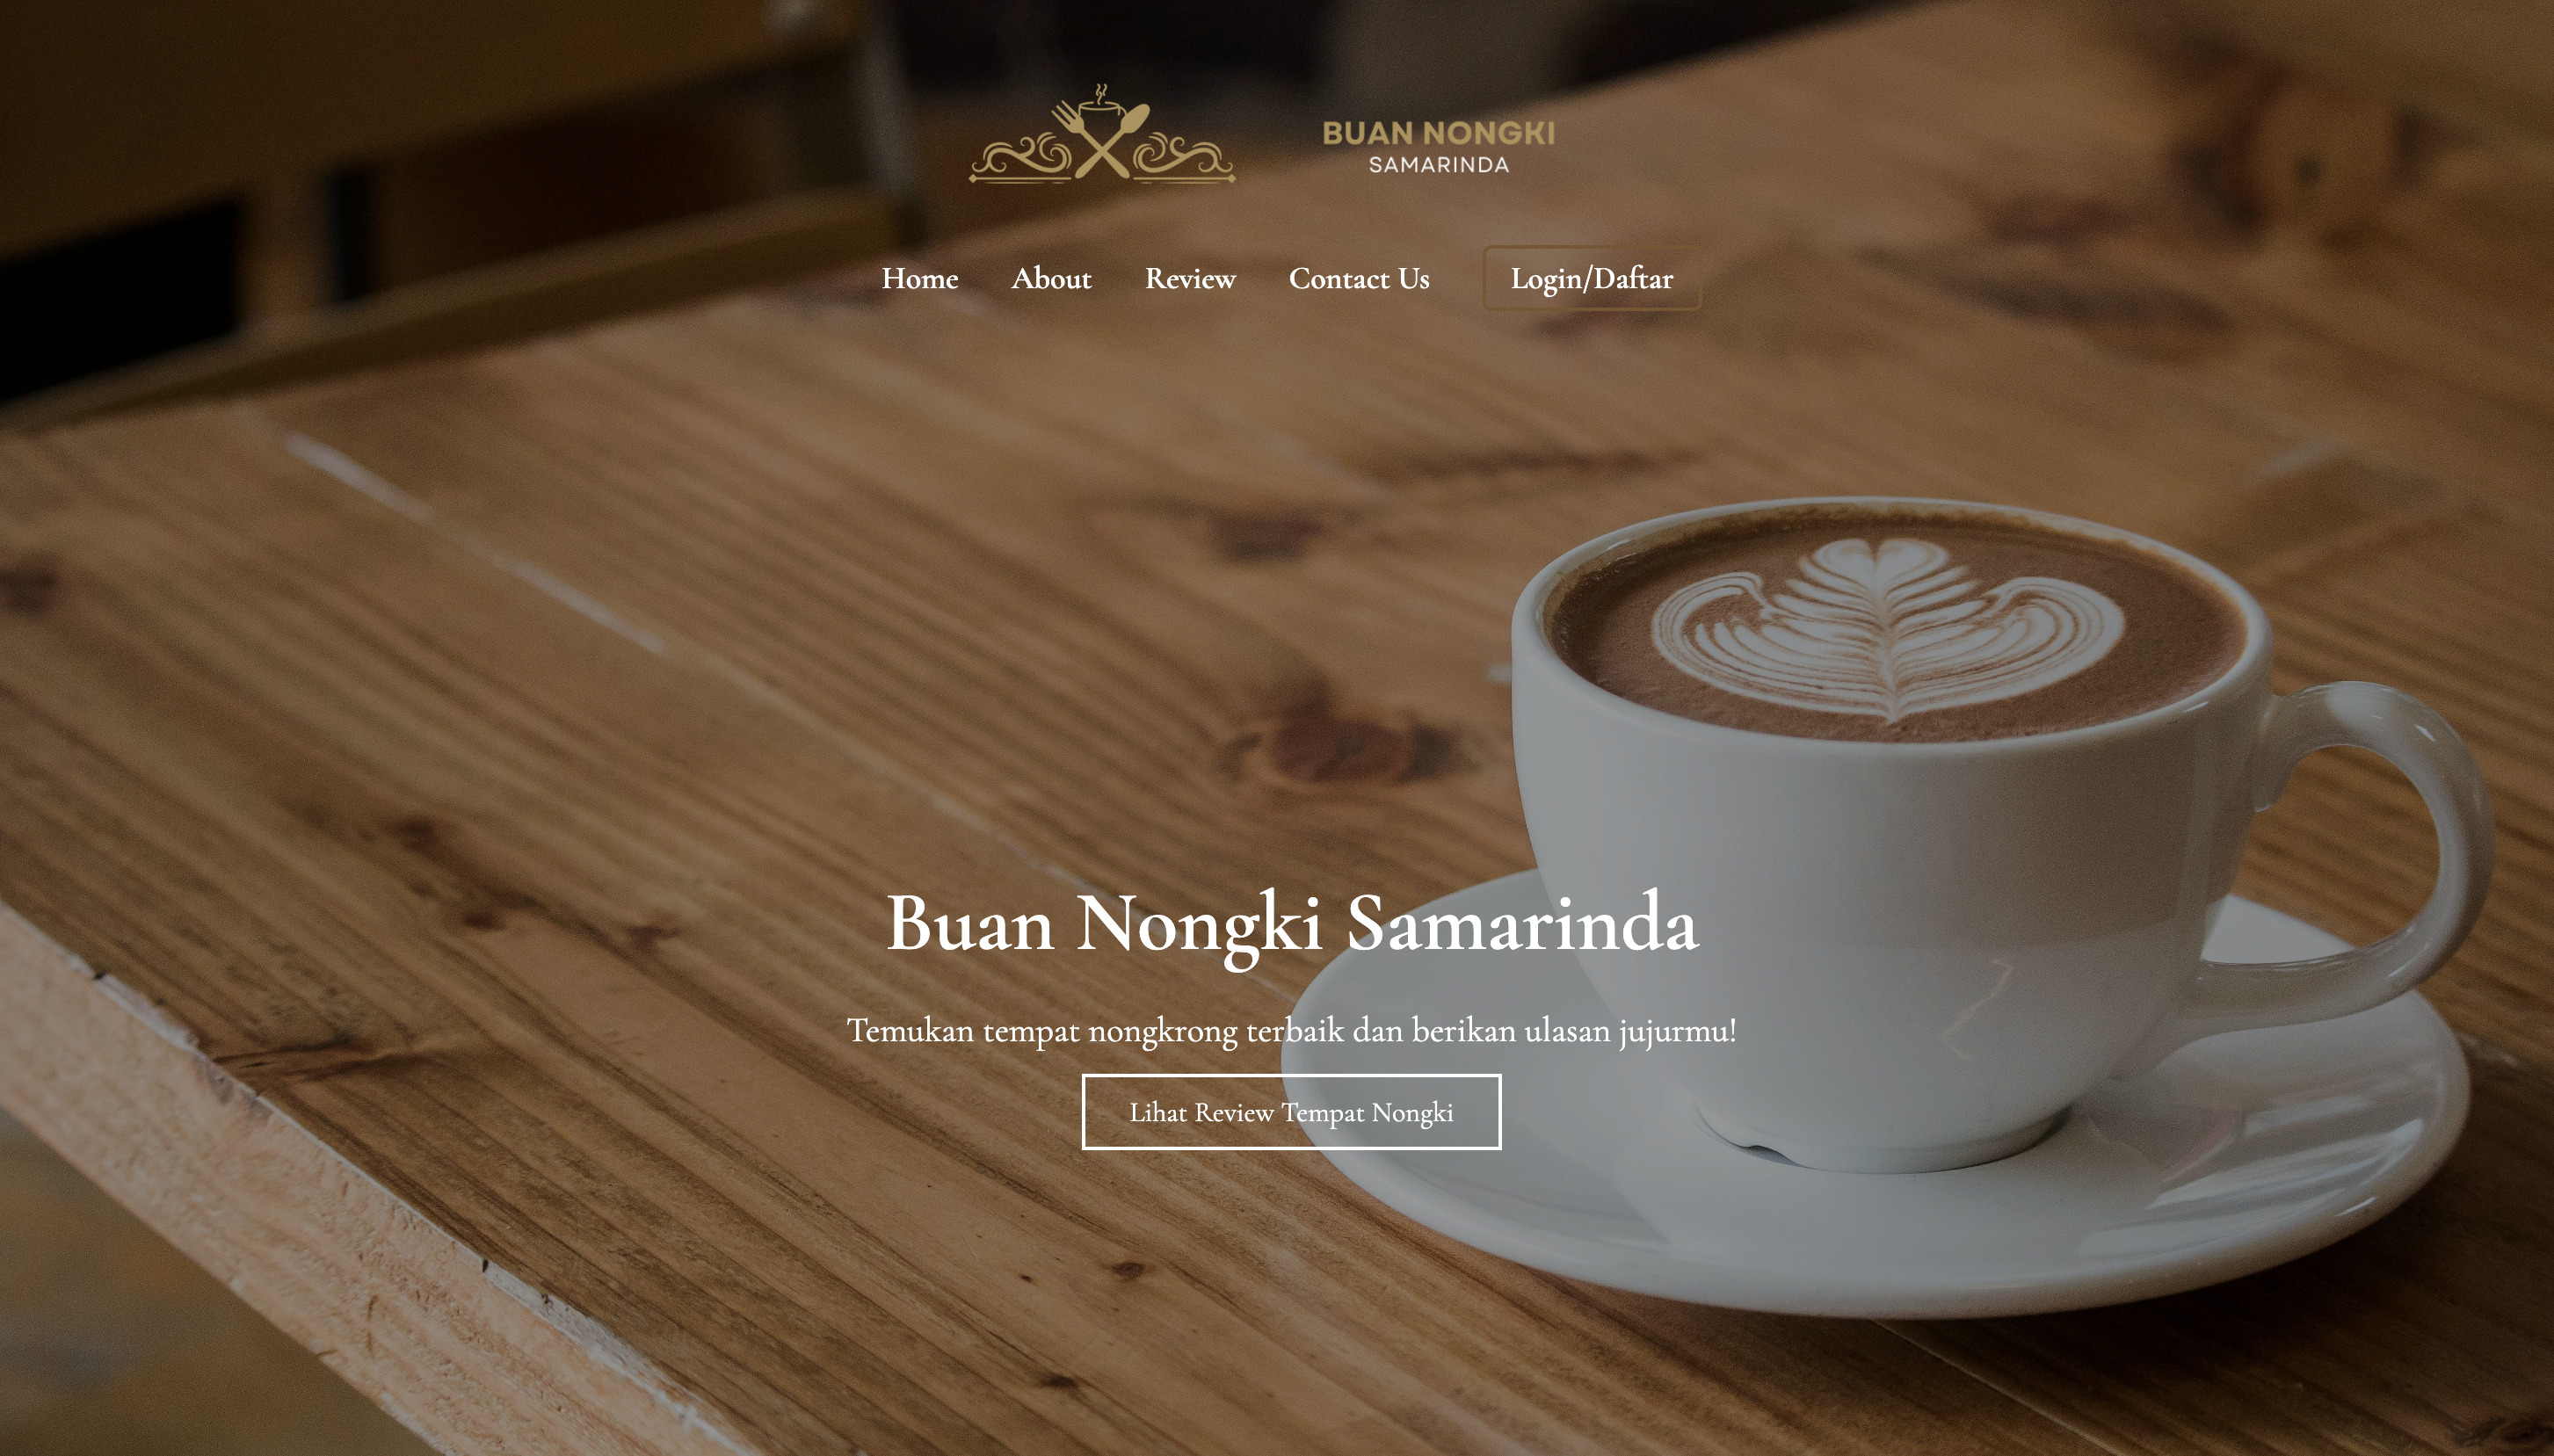
A website for finding cafes and hangout spots in Samarinda. It lists 55 places across 10 districts, so you can search by name, narrow it down to your area, and see what other people thought before you go.

Asteria Chronicle
The official website for Asteria Chronicle, a medieval-themed event taking place on June 28, 2025. It offers visitors everything they need in one place, including a live countdown, event rules, four registration options, and a complete list of all fifteen partners and sponsors.
Mahakam Lampion Garden
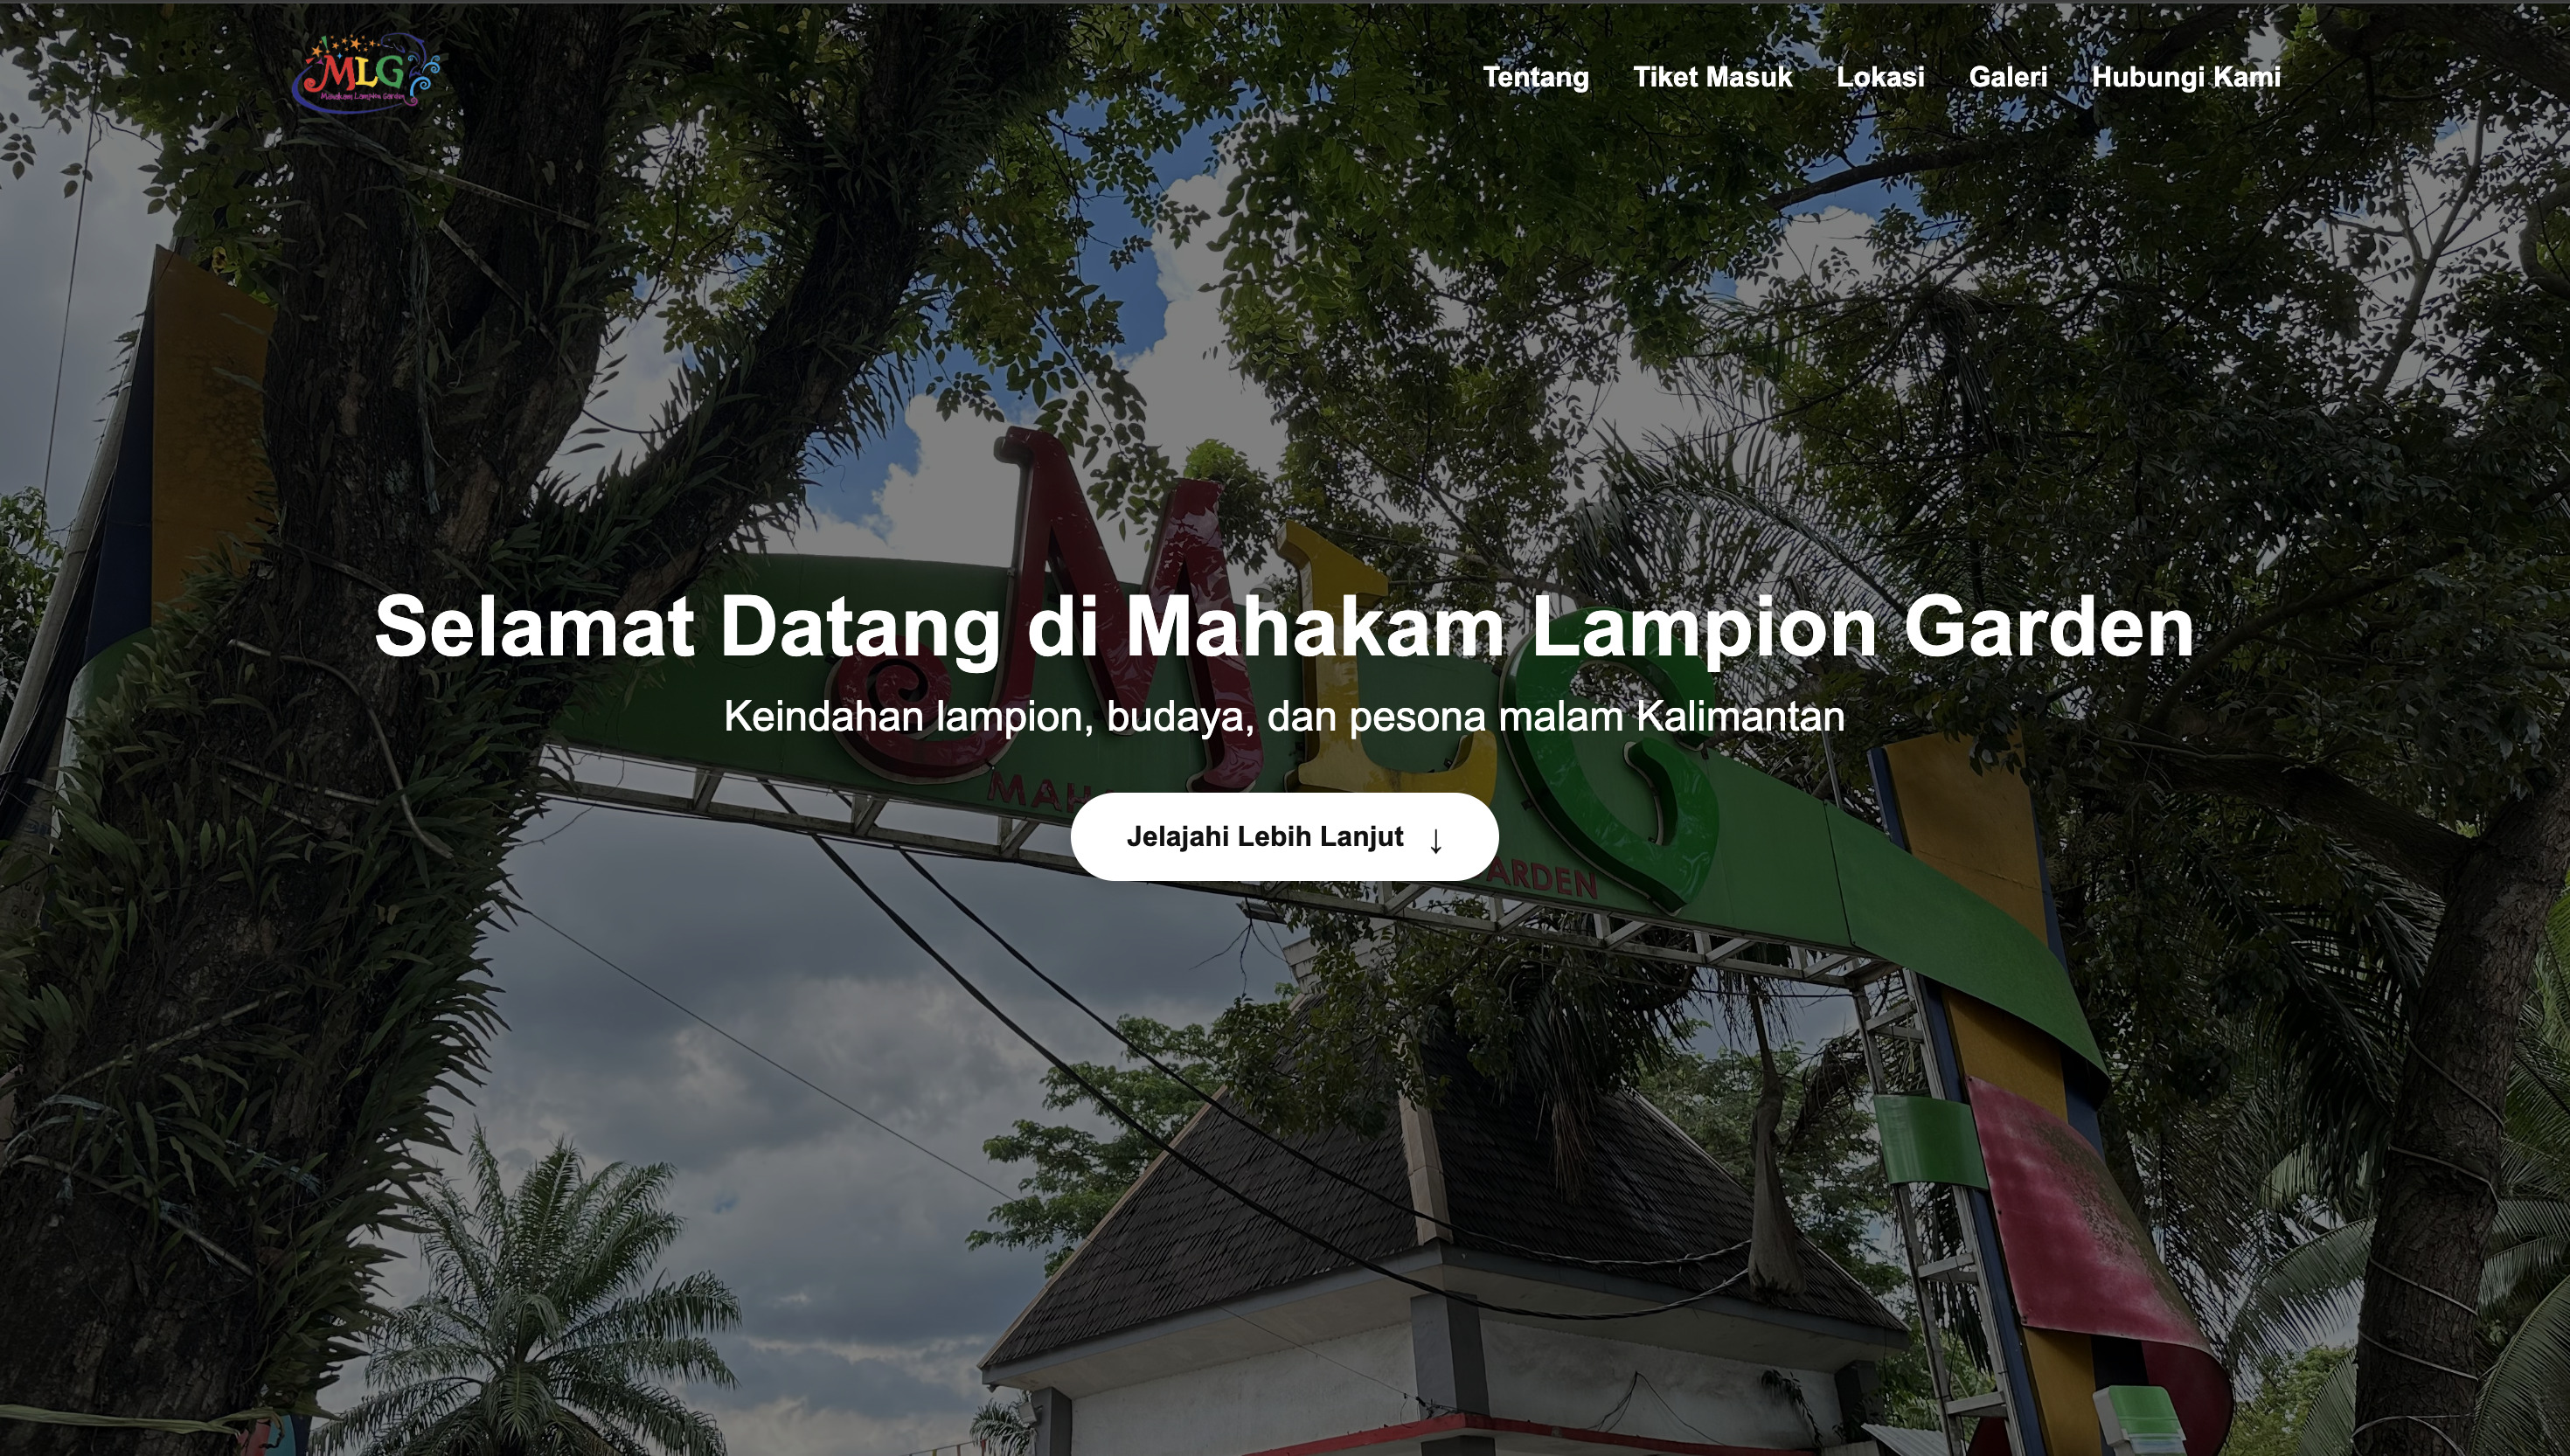
A visitor guide for Mahakam Lampion Garden, a lantern park on the riverside in Samarinda. It covers ticket prices, opening hours, how to get there, and a photo gallery of twelve spots around the park.